DSP FX Visualizer

A visual DSP sandbox for designing and analyzing audio effects

DSP FX Visualizer is a WIP Python desktop GUI application for visually analyzing audio effects. Users build a signal processing chain by wiring nodes together in a visual graph editor, and the application renders the result across three visualization domains in real time: time-domain waveform, FFT frequency spectrum, and impulse response.

Overview

What it does

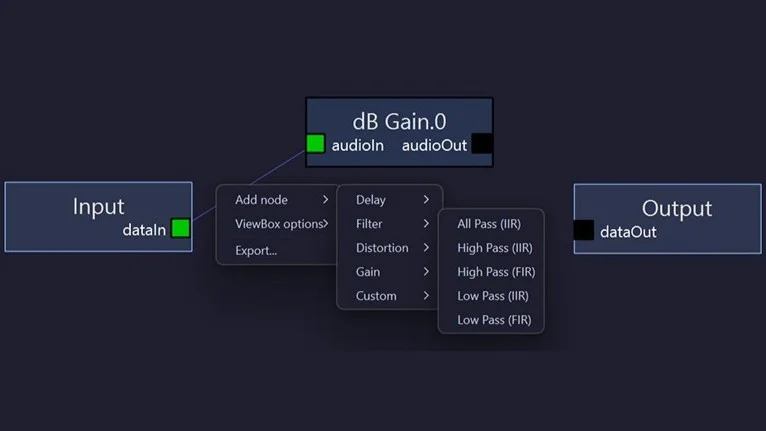
Node-based graph editor

Wire up effects in a directed acyclic graph using a drag-and-drop flowchart interface. Auto-discovery means adding a new FX subclass to fx_lib/ automatically registers it in the node library — no boilerplate required.

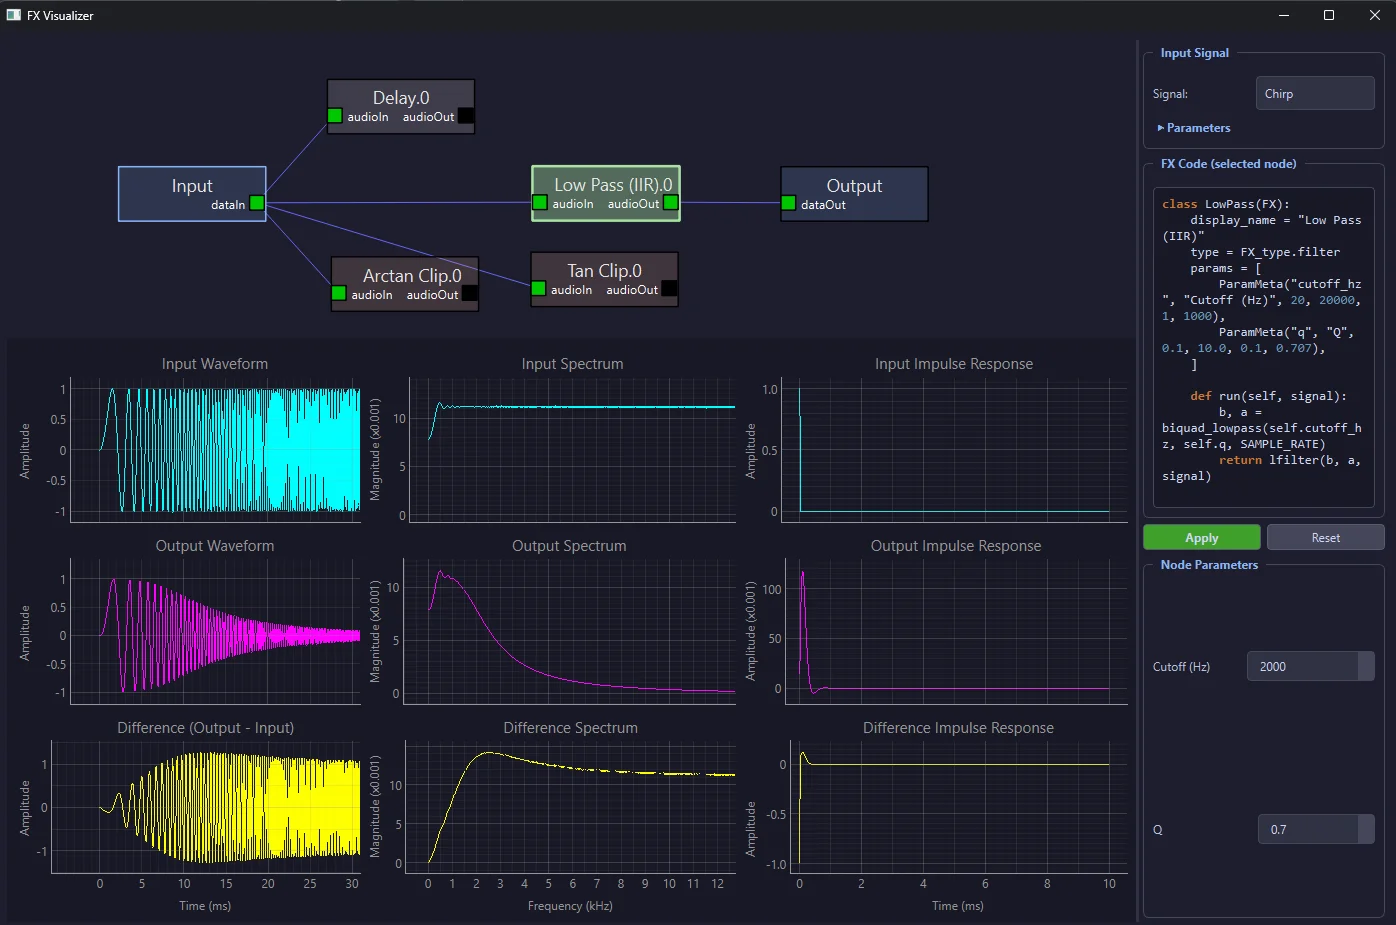
Real-time three-domain visualization

A 3×3 grid of plots showing input, output, and difference across waveform, spectrum, and impulse response domains simultaneously. X-axes are linked across rows for synchronized zoom and pan.

Declarative parameter wiring

Each FX is a class with typed parameter fields — name, range, step, default — that auto-populate the node's UI controls and bind directly to run(). You write the DSP; the UI wires itself.

Generators

Six signal sources for testing any effect

DSP FX Visualizer user interface showing the graph editor and visualization grid
The main UI with the graph editor and 3×3 visualization grid.

From pure tones to complex sweeps

This is a "what you hear is what you see" audio effects sandbox — primarily designed for educational use but also helpful for DSP prototyping, filter experimentation, and distortion analysis.

Six built-in signal generators let you feed any FX chain with precisely controlled input: sine, enveloped sine, multi-sine (additive synthesis with up to 8 harmonics), white noise, a single-sample impulse, and frequency sweeps — linear or exponential chirp.

Each generator exposes its parameters directly in the node UI — frequency, phase, duration, envelope shape — so you can dial in exactly the signal you need without touching code.

Effects library

Plugin-style architecture with auto-registration

Distortion, delay, filters, and beyond

The effect library currently supports distortion, delay, and filter nodes — enough to build meaningful signal chains out of the box. The tool is fully extendable with no overhead: drop a new FX subclass into fx_lib/ and it appears in the node library automatically. No registration code, no boilerplate.

Live code editing lets you click any node, view and edit its Python source, and hot-swap at runtime with a 300 ms debounce. No restarts, no rebuilds, no config files.

The architecture and core DSP nodes are human-designed; agent-assisted development was used to accelerate the UI, auto-discovery system, and visualization pipeline using PyQt6.

DSP FX Visualizer node graph showing connected signal processing nodes
A signal chain built from connected FX nodes in the graph editor.