Android FrameLab

Game performance testing for video production

A multi-part performance testing suite for Android. Starts with data capture over ADB, crunches the numbers into real frame time, FPS, CPU and GPU clocks, and system power draw, and then remaps that data back over the captured footage so you can see what was happening on screen, frame by frame.

Overview

What it does

Data capture

Connects to a target device over wired or wireless ADB and pulls low-level device stats using Google's Perfetto tool — per-app frame timing, CPU usage, GPU clocks, and system power draw — alongside adb screenrecord or Scrcpy to capture what's on screen. Both streams stay synchronised with a shared timeline.

Analysis pipeline

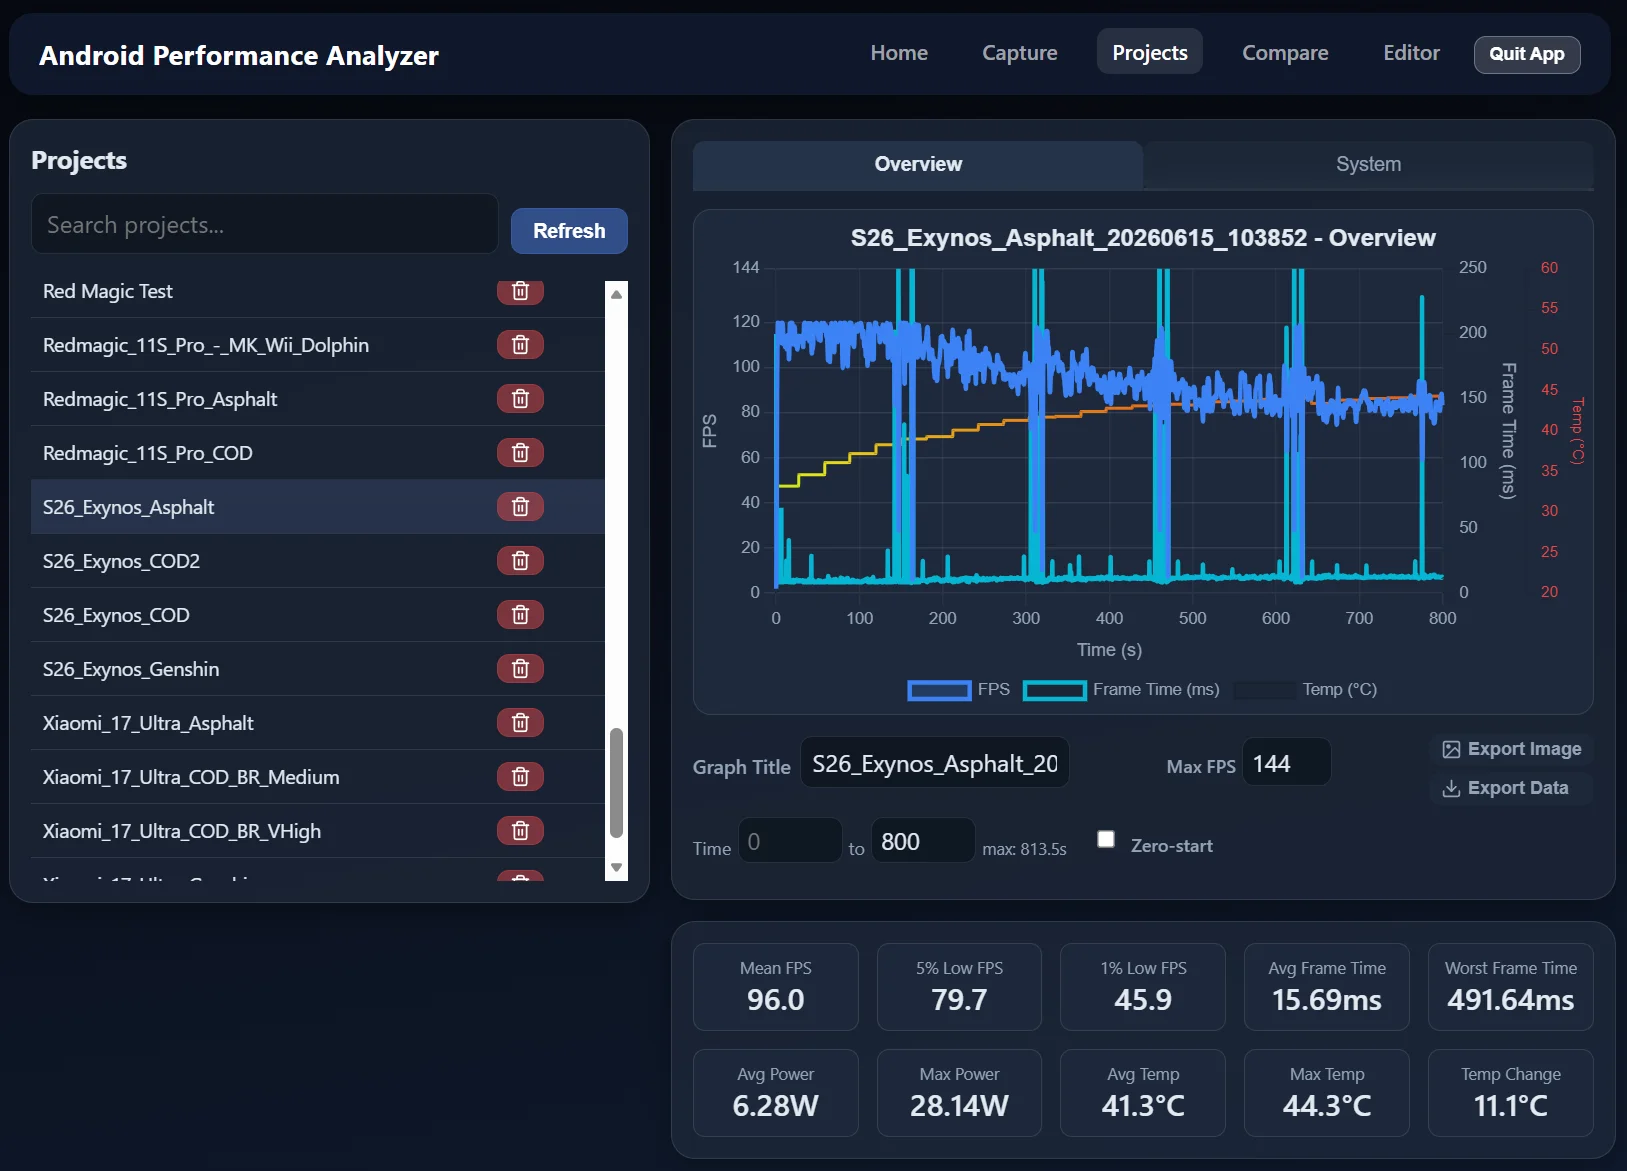
The raw numbers are crunched into reviewer-friendly metrics: real frame time, FPS over time, CPU and GPU clock residency, and extrapolated system power. Results can be compared between capture projects to surface frame drops, thermal throttling, and sustained versus burst performance, complete with built-in chart to image generator.

Built-in video editor

The really interesting part: the analysed data can be remapped back over the project's video capture, enabling side-by-side, frame-aligned performance comparison between devices, ready to drop into a review or video. No external video editing tools required. The video editor supports audio insertion and FFMPEG hardware-accelerated rendering.

Analysis

From raw data to reviewer-ready numbers

FrameLab performance graph showing FPS, frame time, and CPU/GPU metrics over time
Frame time, FPS, and clocks in a single capture run.

Making complex data useful

Projects are saved in their raw format, allowing advanced users to go back in and dive through the trace themselves for a closer look at CPU and GPU clocks, system power, and frame slices. But for fast and efficient content production, FrameLab manages and analyses projects in the same UI, providing key metrics at a quick glance.

The performance graph feature collapses the Perfetto stream into the metrics a reviewer actually needs: real frame time, frames per section, temperature changes and system power. Throttling, sustained performance, temperature spikes, and frame pacing are visible at a glance, helping reviewers answer questions like "where in this game does the frame rate actually break down?"

Projects can also be compared head-to-head, enabling multi-device comparisons of the same workload. Instantly generate graphs showing average and lowest percentile performance, power draw, and temperature comparisons.

Video

Side-by-side comparisons, frame-aligned

Data and video effortlessly combined

The video editor takes the analysed metrics and overlays them onto the captured footage, frame-aligned with the source. The result is the kind of side-by-side performance visual that would otherwise take hours of manual editing to assemble.

Content creators can insert title frames, comparison graphs, side-by-side gameplay comparisons, and audio to suit their needs. The output is a single shareable 4K 60fps video ready to drop into a YouTube review, an article, or an internal stakeholder deck.

The original version of this project was hand-coded in Python. Subsequent feature expansion, performance work, and the expanded video editor have been built with agent-assisted development. The design, methodology, and review of the output remain human-led.

The built-in video editor overlaying performance data on captured gameplay.